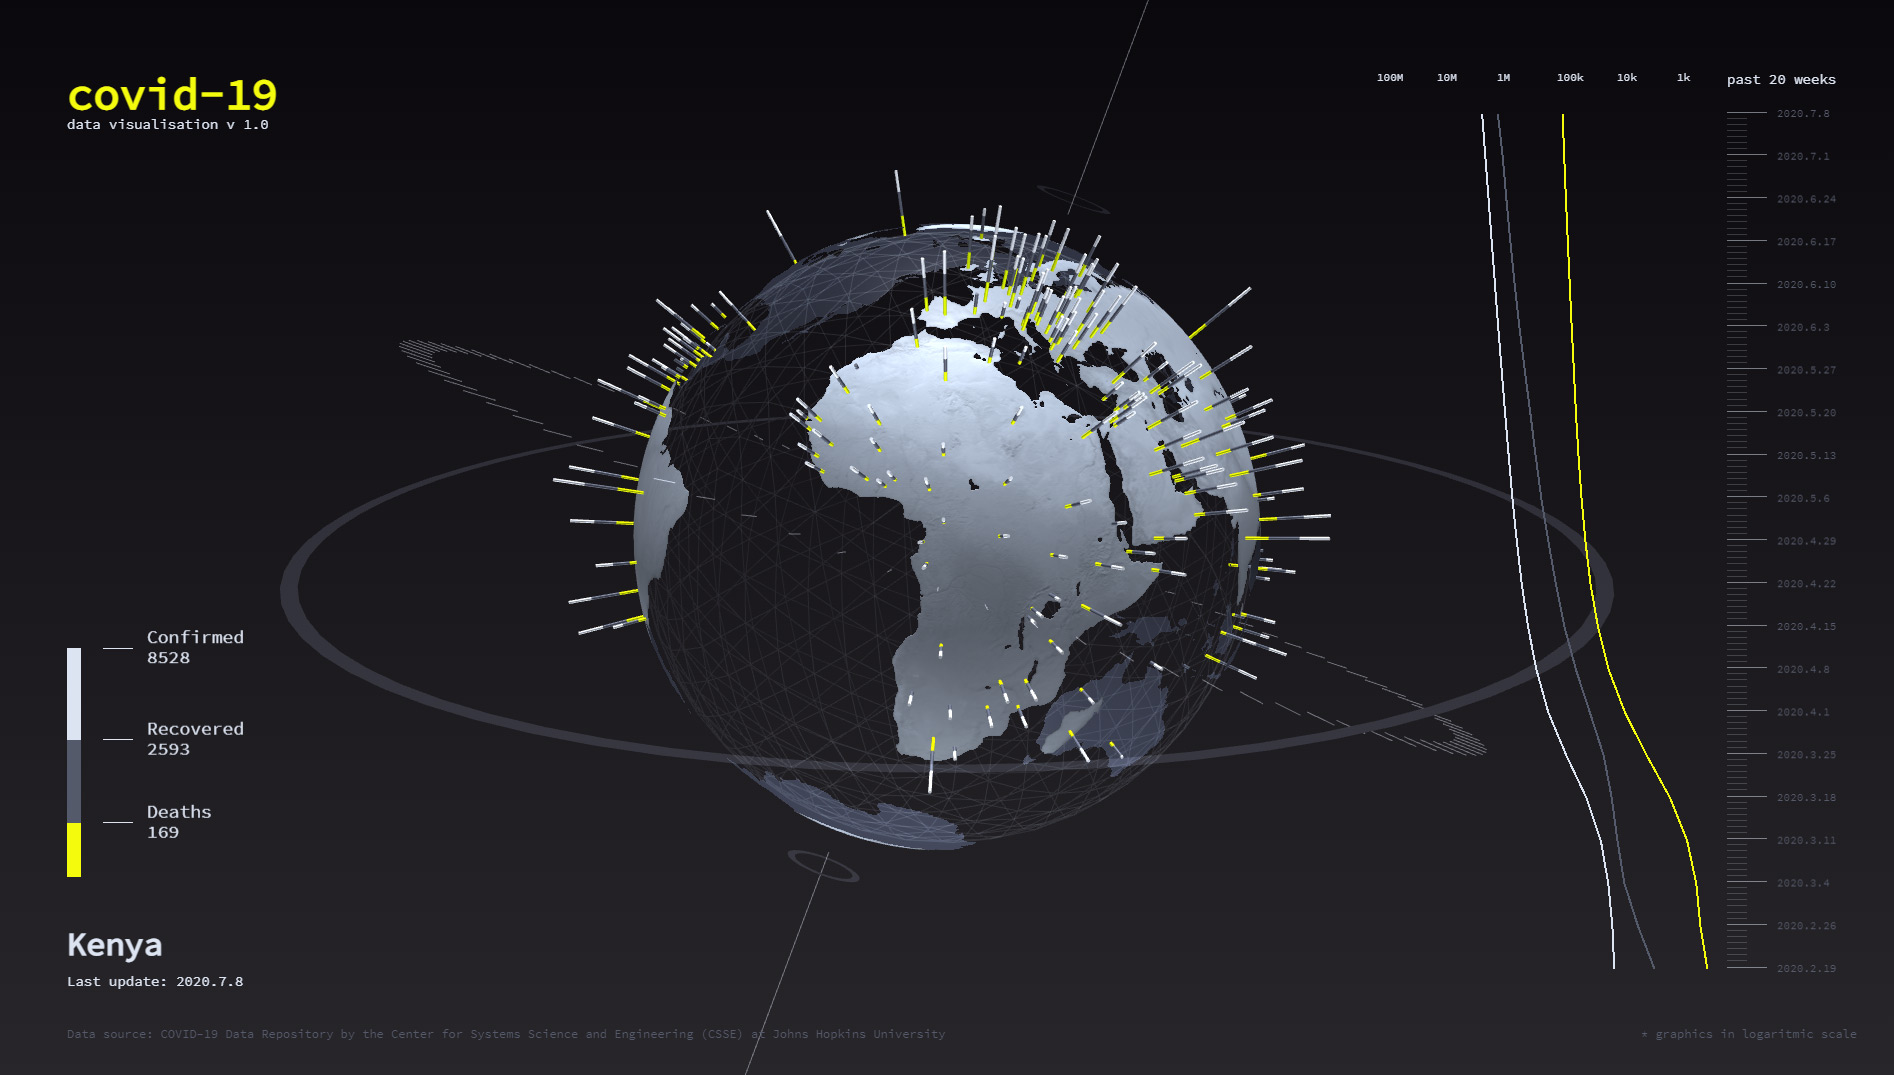
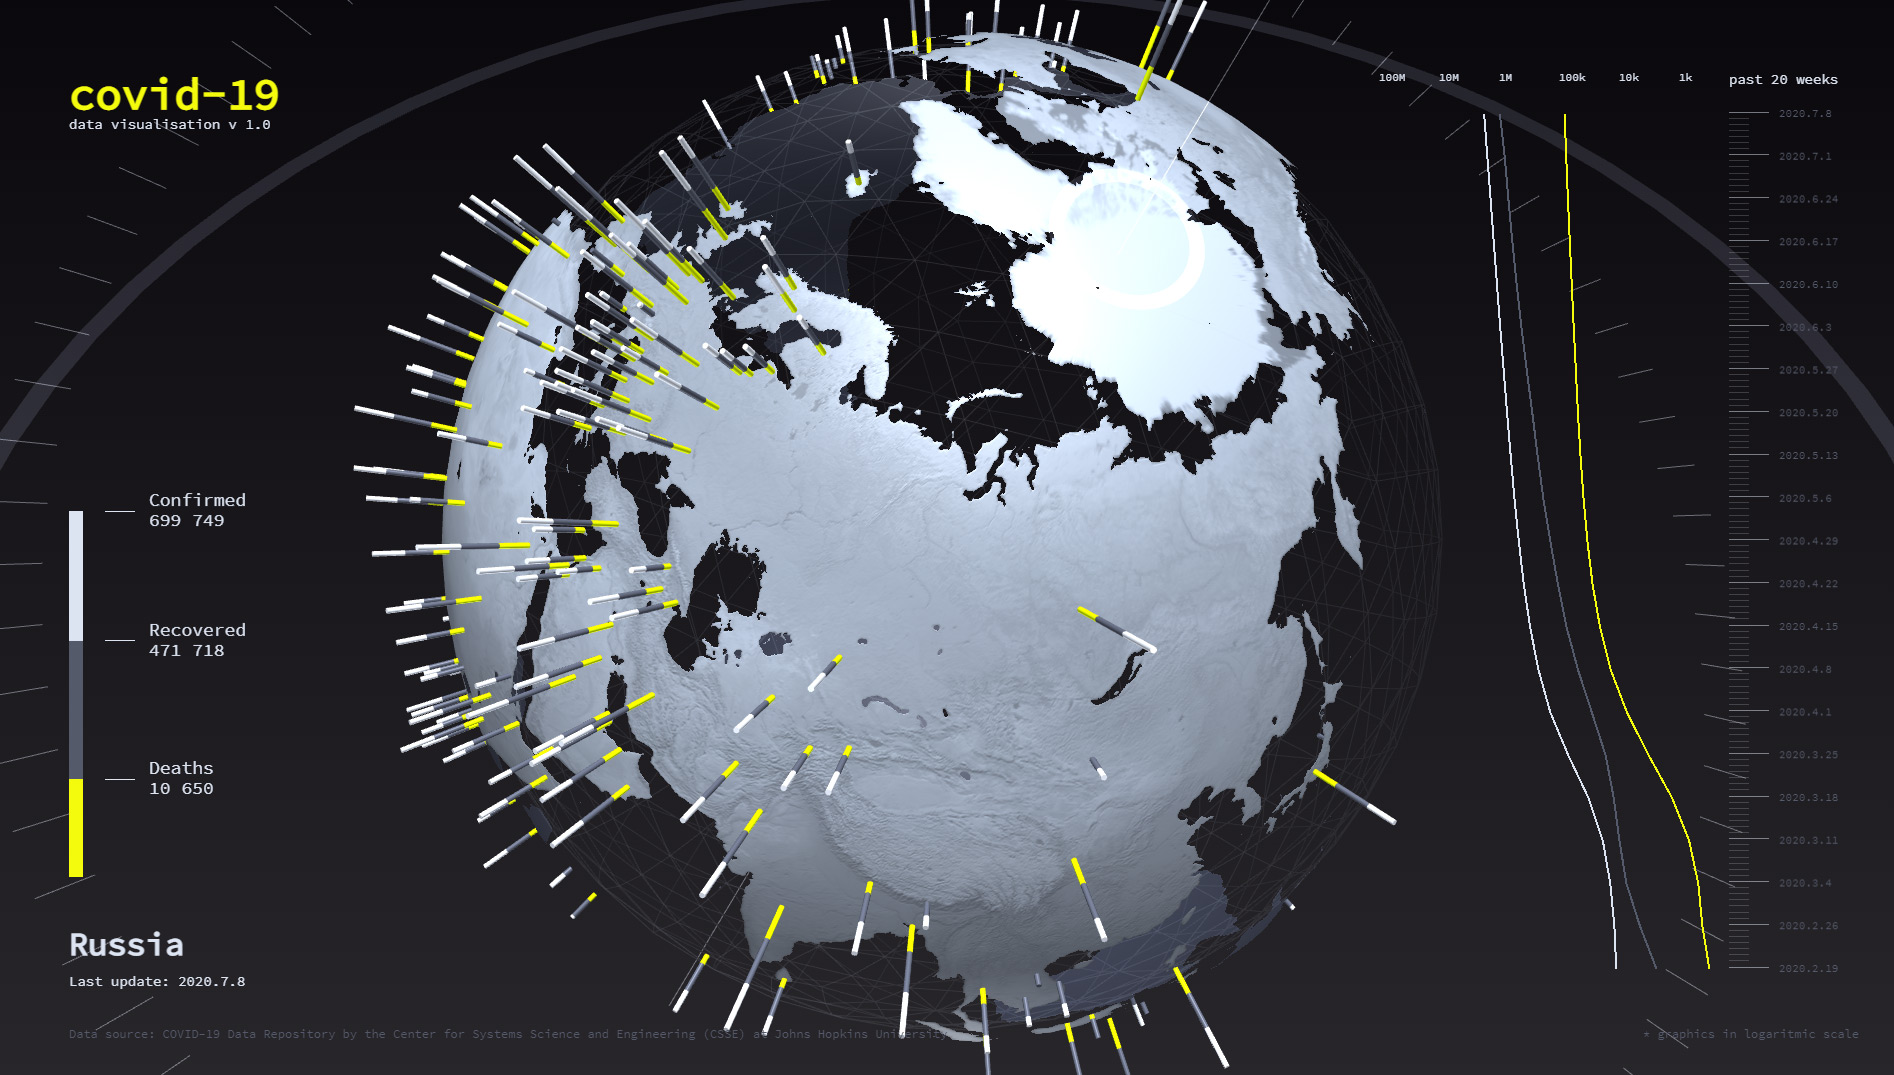
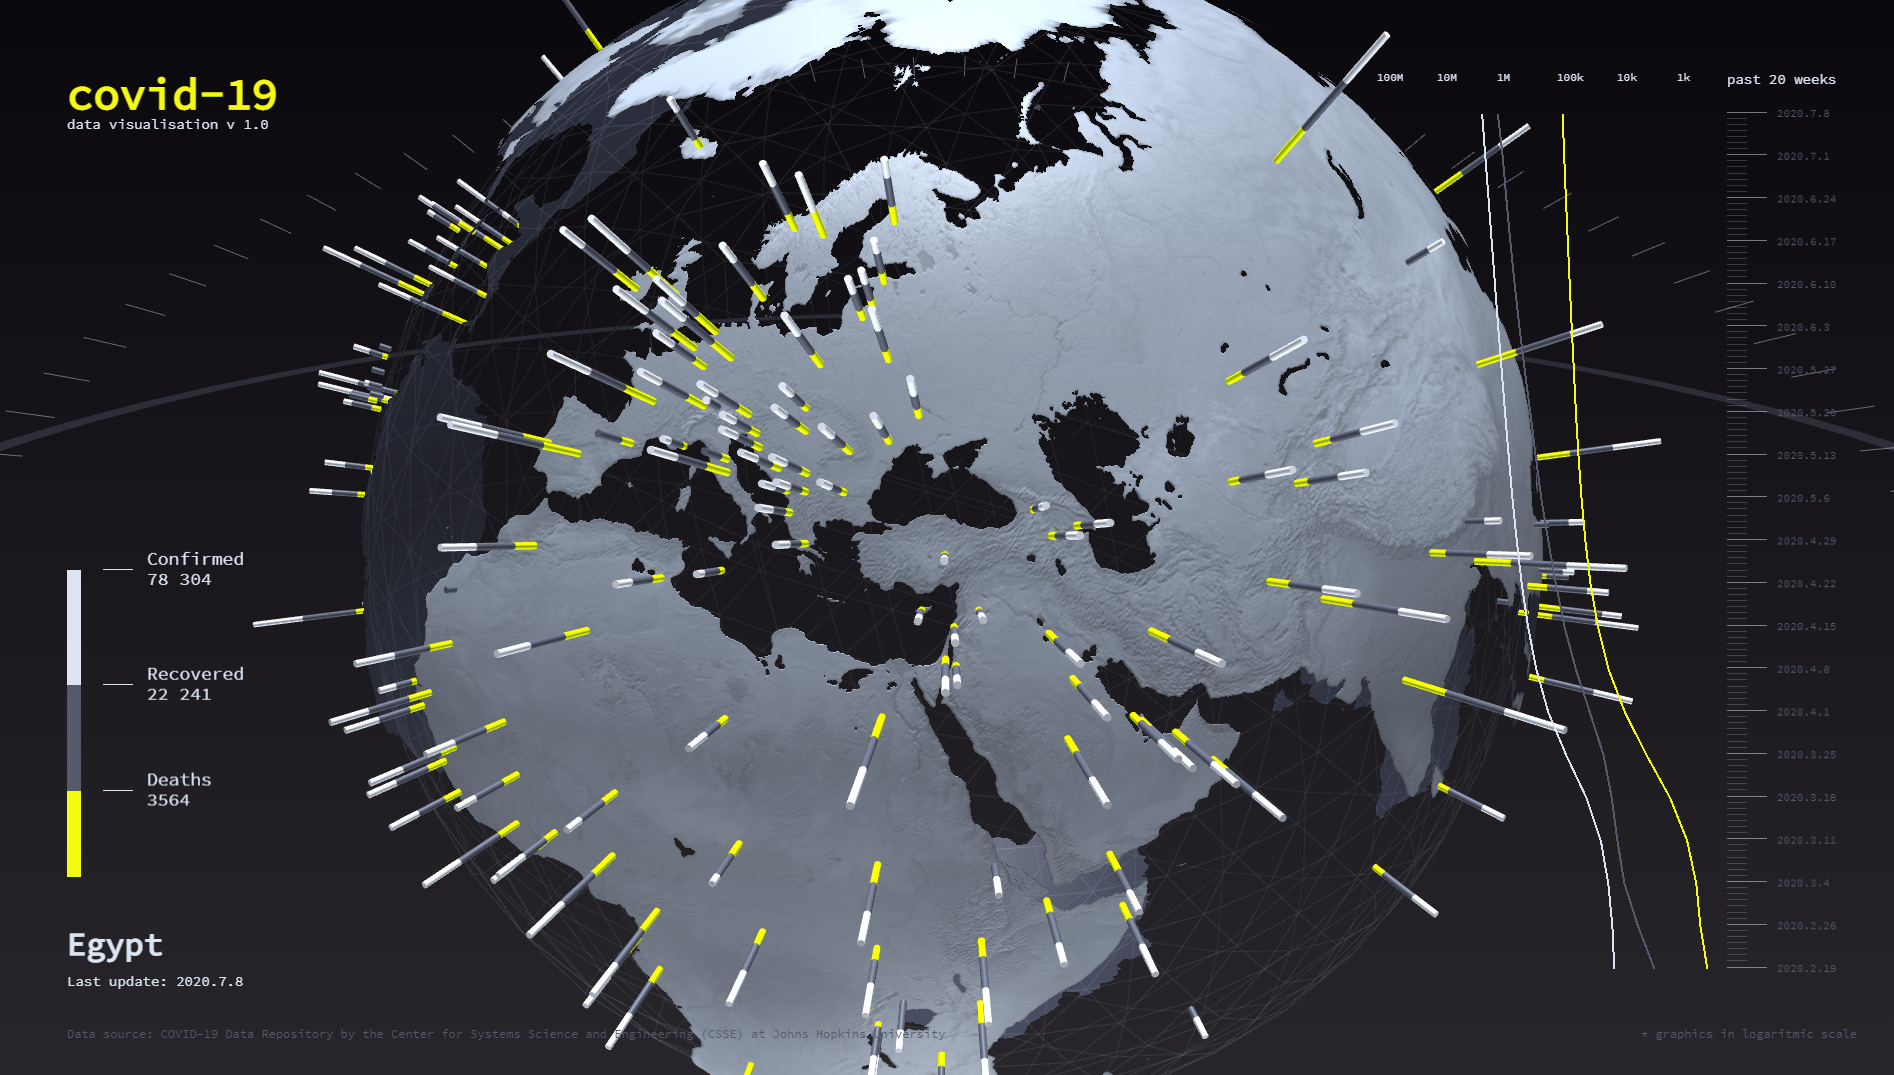
Covid-19 data visualisation
Personal project done during spring 2020 lockdown. Cool way to keep myself busy and learn something new. Interactive global map with visualisation of virus cases, recoveries and deaths in each country. All data loaded from Data Repository by the Center for Systems Science and Engineering (CSSE) at Johns Hopkins University.
Software / Technology
- Three.js
- PixiJS
- JSON
- WebGL